Mythbusting Fantasy Premier League: Form over fixture

Form vs fixtures discussions on Reddit
This post was also published in Towards Data Science at Medium
Over 6 million compete in the Fantasy Premier League (FPL) trying to assemble the best 11 player squad to score the highest over 38 weeks of the English Premier League football. Each player’s score is determined by their performance from actual games such that goal keepers and defenders earn 4 points for finishing a match without conceding a goal (clean sheet) and goal scorers earn 3 to 6 points for each goal or assists depending on their position. To maximize their team’s score, managers must make an informed decision in selecting the players who are most likely to keep clean sheets or score goals every week.
Two popular metrics often discussed among managers are the player’s form and upcoming fixture difficulty. Choosing players based on form means preferring players who have been scoring well or keeping clean sheets in recent matches. However, it is also important to consider fixture difficulty because a player who has been scoring against weaker opponents may not be as likely to score against tougher teams.
In deciding between the two metrics, I noticed that managers often tout “form over fixture” on Fantasy Premier League communities but found few analyses comparing the two metrics in predicting clean sheets or attacking points (i.e., assists or goals). The impact of fixture difficulty has been analyzed by Peter Blake but it only accounted for fixture difficulty and not player’s form. Therefore, to test whether form is indeed more important than fixture, I used FPL data since 2016 to compare their contributions in predicting clean sheets and attacking points in FPL.

Sample screen of Fantasy Premier League
1. Finding data and defining form and fixture
I was able to gather the past two season’s data collected by Vaastav Anand through FPL’s API. After acquiring data for the past two seasons (2016–17 and 2017–18), I defined player’s “form” as the previous 6 week average of their performance identical to how it is defined in the official FPL website. Fixture difficulty was determined as follows: top 2 teams were given a fixture difficulty ranking of 5, teams ranked between 3rd to 6th on the table were ranked 4, teams ranked between 7th and 12th were ranked 3, and teams ranked between 12th to 20th were ranked 2. This is not exactly how it’s defined on the official FPL website which claims to use a “complex algorithm developed by FPL experts” but seems like a close enough approximation.

Fixture Difficulty Ranking Chart
I will jump to the results but all the data and code for the analyses are available here.
2. Estimating fixture and form contributions to clean sheets
First of all, I assess how fixture difficulty affects the probability of finishing with a clean sheet. In the left panel of Figure 1, we can see that fixture difficulty of the opponent reduces the probability of a team finishing with a clean sheet. About 15% of teams keep a clean sheet against a team with a fixture difficulty of 5 (e.g., last season’s Manchester City and Manchester United) where as about 30% keep a clean sheet against a team with a fixture difficulty of 2 (e.g., last season’s West Bromwich Albion or Stoke City). We also see a home-team advantage such that clean sheets are more likely when the team was playing home.
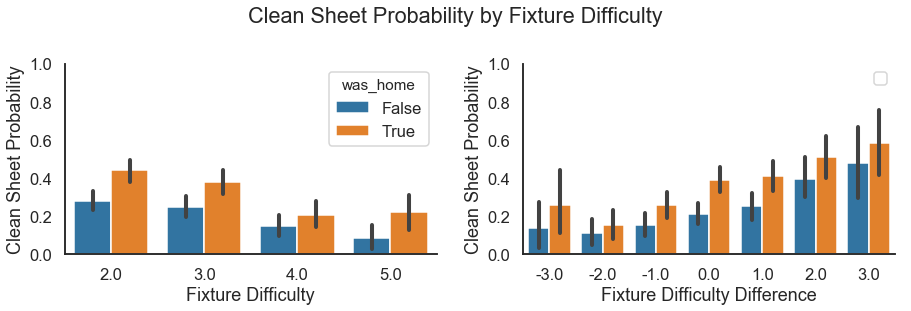
Figure 1. Fixture difficulty on clean sheet probability. Left panel uses the opponent’s fixture difficulty. Right panel uses the difference between the playing team and the opponent team’s fixture difficulty ranking such that higher difference suggests that a high caliber team is playing a low caliber team. Error bars are 95% confidence intervals
In addition, we could also consider the fixture difficulty difference between the two teams. For instance, Manchester City had difficulty ranking of 5 suggesting they are a difficult team but if they play against a similar caliber team, the difference between the two can be more predictive of clean sheet possibility. The difference was calculated as the playing team’s fixture difficulty minus the opponents fixture difficulty such that higher values would indicate a greater advantage. As expected, we can see from Figure 1 right panel that clean sheets are more likely when a stronger team plays a weaker team.
Now, in order to test whether players’ form or fixture difficulty can predict clean sheets we can train a machine learning model with form and fixture as features. By standardizing the features we can compare whether one contributes more than the other to predicting clean sheets. I trained a logistic regression model on individual player’s with repeated K-folds cross validation. This way we can also see how stable the coefficients are across different folds of the data.
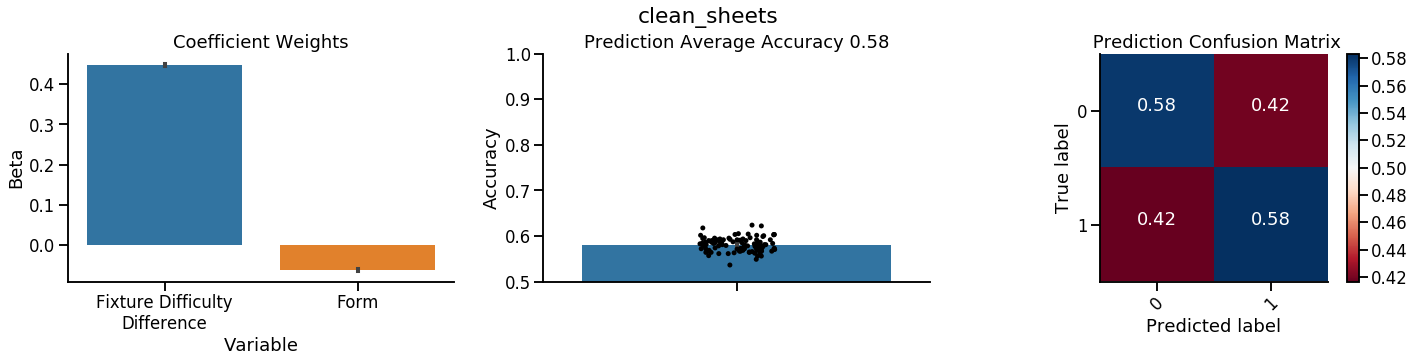
Figure 2. Form vs fixture on clean sheets. Left panel shows average coefficient weights of fixture difficulty difference and form in predicting clean sheets. Middle panel shows average accuracy in predicting clean sheets which was 58%. Right panel shows the confusion matrix in accurately predicting clean sheets (coded as 1). Error bars are 95% confidence intervals
For this analysis, I only included defenders and goal keepers who played more than 60 minutes in the game as they are the ones who would get the clean sheet points if they do not concede a goal. The left panel of Figure 2 clearly shows that fixture difficulty difference between the two teams is a stronger predictor of clean sheets than player’s form. Although the model’s accuracy is not great with an accuracy of only 58% we can still conclude that when selecting goal keepers and defenders who rack up most of their points through clean sheets, managers should consider fixture more than form.
3. Estimating fixture and form contributions to attacking points
Goals scored in matches are also affected by fixture difficulty. At the team level, we can see from Figure 3 left panel that playing against higher caliber teams (i.e. fixture difficulty of 5) result in slightly less goals than playing agains easier opponents (fixture difficulty 2). From the right panel of Figure 3, we can also deduce that we can expect to see about two goals when a top ranked team plays a bottom of the table team but around 1 goal for most other matchups.
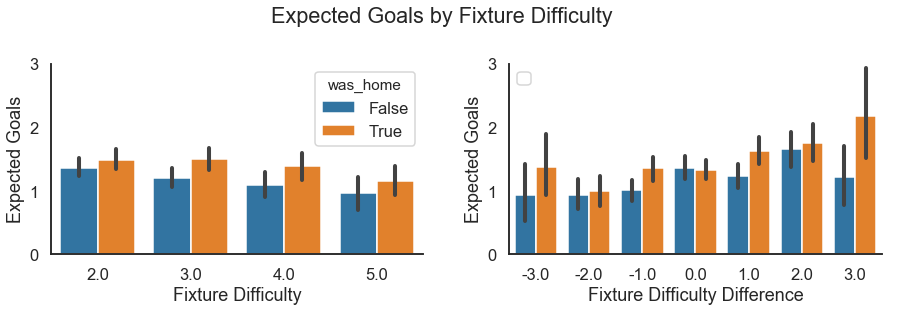
Figure 3. Fixture difficulty on attacking expected goals. Left panel uses the opponent’s fixture difficulty. Right panel uses the difference between the playing team and the opponent team’s fixture difficulty ranking such that higher difference suggests that a high ranked team is playing a lower rank team. Error bars are 95% confidence intervals
However in FPL, players get points not just for goals but also for assists. Therefore I decided to use attacking points, defined as either scoring a goal or an assist in a match, as the dependent variable. Similar to the clean sheet analysis, I only included midfielders and forwards who played more than 60 minutes in the game as they are the ones who need to get attacking points. Now we run the logistic regression model again to predict attacking points with players’ form and fixture difficulty difference.
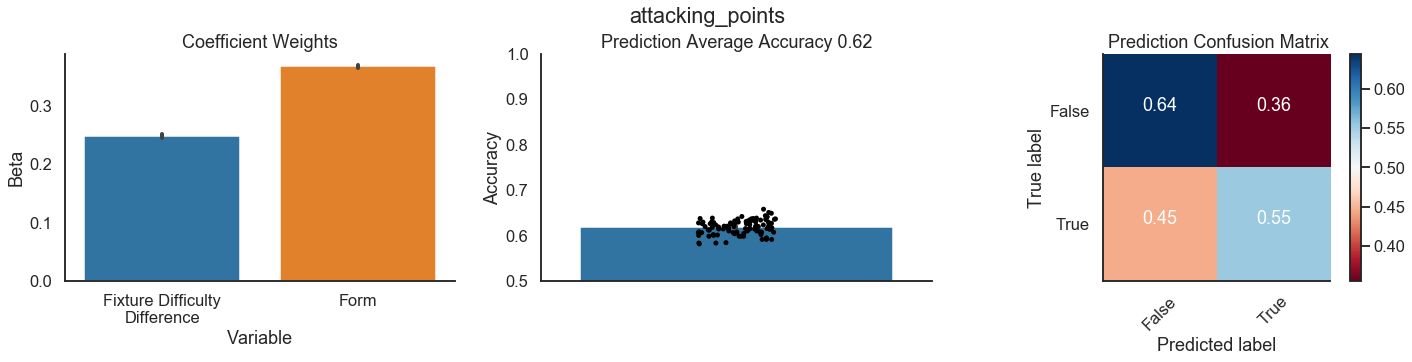
Figure 4. Form vs fixture on attacking points. Left panel shows average coefficient weights on fixture difficulty difference and form. Middle panel shows average accuracy in predicting clean sheets which was 62%. Right panel shows the confusion matrix in accurately predicting attacking points (coded as True). Error bars are 95% confidence intervals
Here we find that both form and fixture differences contribute to the probability of a player scoring either a goal or an assist but that form is more important than fixture (left panel of Figure 4). Prediction accuracy was 62% and it better predicted the likelihood of not getting any attacking points (specificity) than scoring an attacking point (sensitivity; confusion matrix in right panel of Figure 4). From this we can conclude that managers should consider form over fixtures for midfielders and forwards.
What we learned
Here we tested the popular myth in FPL that player form is more important than fixture. It turns out that at least for defenders, fixture was more important than form. They are more likely to get clean sheets when playing against a weaker opponent regardless of form. In contrast, the myth turned out to be true for midfielders and forwards that form was indeed more predictive of attacking points than fixture difficulty although it still was an important factor in predicting attacking points.
Conclusion
There were several assumptions and caveats in the analyses that are important to keep in mind. For example, fixture difficulty differences should be considered more as an ordinal variable in which spacing between differences are probably not linear in reality. Also, I used a logistic regression for simplicity but a Poisson distribution could be a better fit with such data. Moreover, the prediction accuracies were poor which is probably near the noise level if the models were permuted (see my previous post about the importance of permuting models). This leaves the possibility that other variables could be much better predictors of clean sheets and attacking points than form and fixture but that would be another post. Thank you for reading and feel free to leave any comments or suggestions.
fantasy-premier-league sports sports-analytics data-science football