Three reasons to watch #SLICED: A real time data science competition

Photo by Nikolai Chernichenko on Unsplash
This post was also published in Towards Data Science on Medium
Watching Data Scientists solve new datasets can be educational, entertaining, and an immersive experience.
#SLICED is a 2-hour data science competition streamed by Nick Wan and Meg Risdal on Twitch. Contestants code in real time exploring, cleaning, and analyzing a never-seen dataset to win the most points for training a model with the best prediction accuracy and data visualization.
I stumbled on #SLICED when I noticed that a friend of mine tweeted that he was a contestant on the show. As a data nerd, I decided to check it out. In a few minutes, I was hooked. And here are three reasons why you should check it out too
📊 Peak into the thought process of Data Scientists
As soon as the clock hit 9pm, contestants began to code away. They were tasked to predict online ratings of board games with information about the games such as they year it was designed, estimated game time, required number of players, and so on.
Watching the contestants approach this question was fascinating because it really allowed you to see their thought process in solving this problem in real time. Most contestants began by exploring the dataset with some form of a QA process. They looked and checked for things like 1) missing values, 2) data types of columns, 3) correlation among variables, and 4) the distribution of values. You often hear in data science articles how important these steps are but it was even more compelling after seeing real data scientists spontaneously engage in these procedures.
You could also learn about new tools, tricks, and packages used by the contestants. Python using contestants similarly began with gradient boosting models with one contestant who began by installing and loading Catboost in Google Colab. At the time, I had no idea what Catboost was and I mistakenly assumed he was talking about the Corgis & Cats of Colab. But in a few minutes, I learned that Catboost was an open source gradient boosting library that is highly customizable and easy to use!

Photo by Manuel Rheinschmidt on Unsplash
The R users diverged with one participant trying out linear mixed effects models (LMER) while another using Tidymodels (btw another package that I newly learned from the show!). As a big fan of LMER for repeated measures data, I was glad to see the diverse approaches taken by the contestants.
🏘 Feel the data science community
Watching SLICED allows you to feel that you are part of a larger data science community. Seeing so many people share a similar passion for data analysis, from the contestants to the people watching the show, it gives you a sense of how broad and diverse the community is. Learning about the contestants and viewers’ backgrounds also give you the sense that there is room for everyone in the data science community to fit in regardless of what language or training you had.
As mentioned earlier, two contestants were coding in Python & Jupyter Notebooks while the other two were using R & RStudio. One contestant actually began by using both (!!). The diversity of tools being used really promoted the idea that you don’t need to learn one particular language to become a data scientist. It doesn’t matter whether you code in R or Python as long as you can munge the data and know how to make good statistical inferences.
In addition to the sense of solidarity among Python or R users, I was also excited to find out about the diverse background of the contestants. There were people with training in neuroscience, linguistics, sports analytics, and even music. It felt amazing that a group of people with such diverse backgrounds can gather around, communicate, and have fun together over a shared of interest for analyzing data.
🥇Participate and take a shot at the competition!
The coolest part of #SLICED is that YOU as a viewer can still participate! The hosts of #SLICED, Nick & Meg, encouraged the stream viewers to participate in the competition. This gives you the chance to actually be involved and share the data journey experience along with other contestants which I think creates an immersive experience. At first I was hesitant, but after seeing a few people in the chat upload their submissions to the competition page, I mustered up the courage to see how my approach would compare to others.
At first, I thought I could be clever by fitting a PCA to reduce the dimensionality of continuous values which failed miserably and barely achieving an accuracy (RMSE: .38) slightly better than baseline (.48). I dug deeper and tried Ridge regression and the Catboost gradient boosting model that I just learned from the contestants. When the time was up I was 9th out of 20 participants on the public leaderboard which used 1% of the test data for evaluation, but when the private leaderboard was announced (estimated using 99% of test data) my rank surprisingly jumped to 2nd place which was a pleasant surprise!
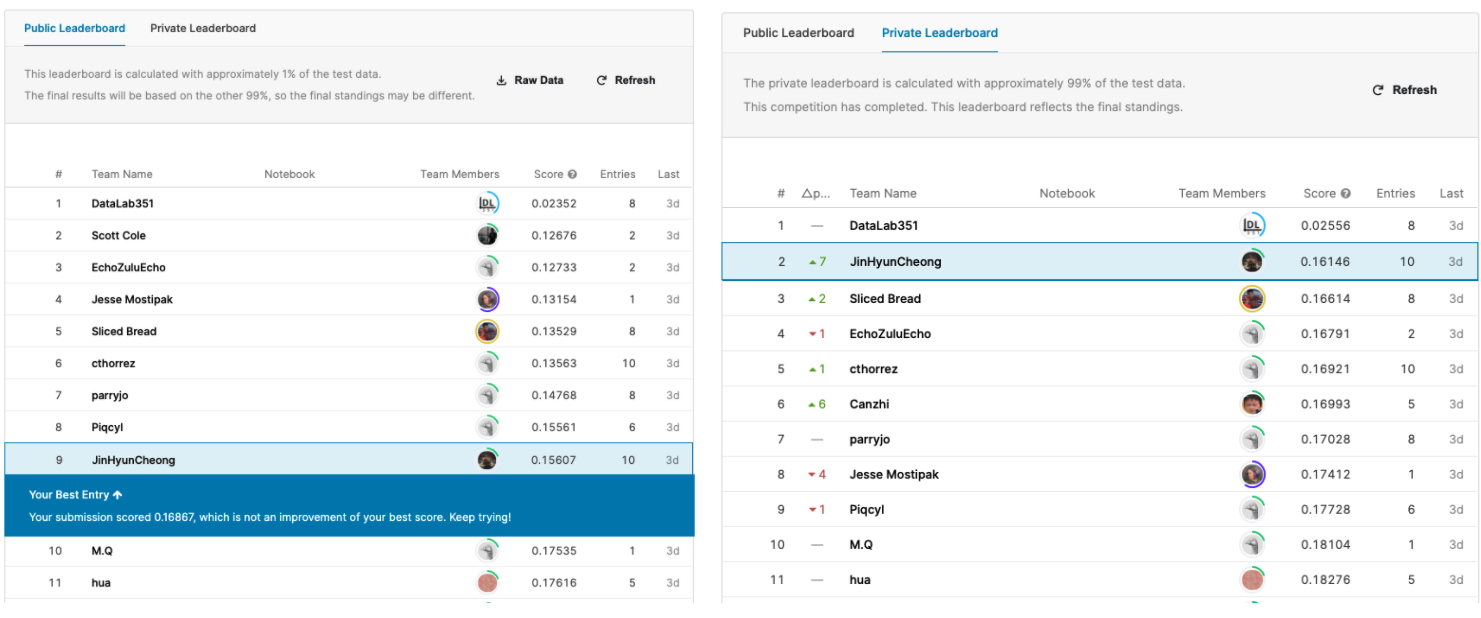
Beginner’s luck! Left: Leaderboard using 1% of data; Right: Final leaderboard using 99% of data.
I think parsing the game mechanics and game categories and translating them to dummy variables (+ pure luck) helped my model. See my (messy) Colab notebook here:
Conclusion
If you are someone who gets excited about analyzing data and learning about new visualizations, I highly recommend checking out #SLICED. It’s a whole lot of fun and I learned so much already from just one evening of watching four data scientists duel it out on who can build the best predictive model. I’ll certainly be there to check out the next episode which I believe is this Tuesday at 8:30pm EST (check out the schedule here) which will be streamed on Nick Wan’s channel on Twitch.
*Disclaimer: The thoughts and opinions about SLICED are my own and I am not an associated person with #SLICED or the hosts in any way. I just really enjoyed watching the show :).
machine-learning statistics data-science python r